A DEXA scan is the most common imaging test that health practitioners use to screen for Osteoporosis. If you have ever had a DEXA scan, it is quite possible that you looked at the report with some confusion about what the scan measures and what all of the numbers on the print out actually mean. In this article we will try to help you understand this, however it is important to note that the information provided here is general and should not be used for diagnosis or to replace the advice of your qualified health professional.
So what actually is a DEXA?
The word DEXA stands for Dual Energy X-ray Absorptiometry and involves the use of very low level X-rays (around 10% of the levels you would get from a chest X-ray) to assess the density of your bones. As the name suggests, 2 different types of X-ray beams (high and low energy) which are absorbed differently by bones and soft tissues are sent through the body by the moveable arm on the DEXA machine. The energy that is not absorbed is detected on the other side of your body by components underneath the platform that you lie on. The more dense your bones are, the more energy that is absorbed and hence the lower the amount of energy detected on the other side of your body. Software allows calculations to be made from the results that give a score of the average density of the bone.
A typical DEXA scan will involve scanning at least two out of three possible sites; the lower back, hip and wrist. These areas are specifically chosen as they are the areas that osteoporotic or minimal trauma fractures are frequently identified in. The choice of region used will depend on any previous surgeries – for example if you have had spinal surgery or a hip replacement, these regions will not be used as the implanted devices will change the result. If none of these areas have been operated on, the DEXA operator will choose to scan the hip and the lower back regions.
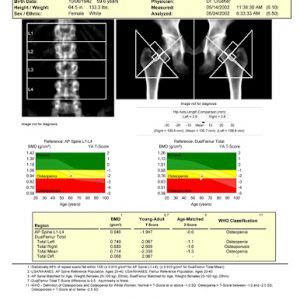
The report will contain a picture of the regions scanned. There will also be a table that contains the following headings:
- BMD. This is the average density of the bone for the given region. The higher this value is, the greater the density of the bone is.
- The T score. This is a score that compares your result to the average peak bone mass of a healthy young adult. The T score represents the number of standard deviations your score is away from the average young adult score. If your T score value is 0, this means that your bone density score is the same as that of a young adult. A T score of -1 indicates that your score is 1 standard deviation below a young adult score. The T score is used to diagnose both osteopenia and osteoporosis. Osteopenia is the precursor to osteoporosis that is characterised by lower than average bone density that is at risk of progressing to osteoporosis. A T score value between -1 and -2.5 is classified as osteopenic, and a score of less than -2.5 is classified as osteoporotic.
- The Z score. Like the T score, the Z score is a standard deviation comparison score, however this time it compares your score to people who are the same age and gender as you. It is for this reason that the Z score value is often higher than the T score, as unfortunately research indicates that after peak bone mass is reached it will decline over time.
There are often multiple measurements for each region. For example your lower back (lumbar spine) may include the average of each segment and also the average value for multiple segments combined. In the hips, your report may include both a total value for each side as well as the value in the “neck” of the hip.
It is important to understand that the DEXA score is used to assess your relative risk of sustaining a fracture due to bone weakness. There are many other factors that can affect this risk including regular consumption of steroid based medications, specific medical conditions (eg hyperparathyroidism) and lifestyle factors such as exercise levels, smoking and alcohol intake. DEXA scans are a great way to evaluate the effectiveness of any interventions aimed at improving bone strength such as exercise, medications or the combination of both. It is recommended that subsequent scans be performed using the same machine where possible, and that there is adequate time between scans (usually a minimum of 12 months).